Indiana deer hunting: harvest by county and public hunting properties
Indiana hunters took 131,226 deer in the 2025 season, 62,876 antlered and 68,350 antlerless, by the DNR's White-tailed Deer Report, the most of the five seasons shown. The firearms season runs November 14 to 29, 2026, and the statewide bag limit is 1 antlered and 6 antlerless deer (DNR).
Data updated October 2026. Seasons: the DNR's deer seasons page, read October 2026. Harvest: the DNR's White-tailed Deer Reports. Land: PAD-US 4.1 and the DNR's public hunting property layer.
Indiana hunt plans are coming
Hunt plans for Indiana are coming. Join the list and you'll hear first. The first 50 hunters in each new state get their plan free. Join the Indiana list.
When are Indiana's 2026 hunting seasons?
Indiana's 2026 to 2027 deer seasons, from the DNR's deer hunting seasons page.
| Season | Dates |
|---|---|
| Deer reduction zones | September 15, 2026 to January 31, 2027 (designated zones only) |
| Youth season | September 26 to 27, 2026 |
| Archery | October 1, 2026 to January 3, 2027 |
| Firearms | November 14 to 29, 2026 |
| Muzzleloader | December 5 to 20, 2026 |
Source: Indiana DNR, Deer Hunting Seasons (read October 2026). Antlerless deer may not be taken with a firearm during the firearms season on DNR Fish and Wildlife properties and at Mississinewa, Patoka and Salamonie lakes.
How many deer do Indiana hunters take?
Deer taken statewide, by season, from Table 3-4 of the DNR's yearly deer report; the 92 counties add up to these totals.
| Season | Deer taken | Antlered | Antlerless |
|---|---|---|---|
| 2025 | 131,226 | 62,876 | 68,350 |
| 2024 | 126,169 | 59,643 | 66,526 |
| 2023 | 121,263 | 58,220 | 63,043 |
| 2022 | 121,812 | 58,547 | 63,265 |
| 2021 | 112,482 | 53,752 | 58,730 |
Source: Indiana DNR White-tailed Deer Reports (2021 to 2025 seasons, Table 3-4).
How many deer are taken in each Indiana county?
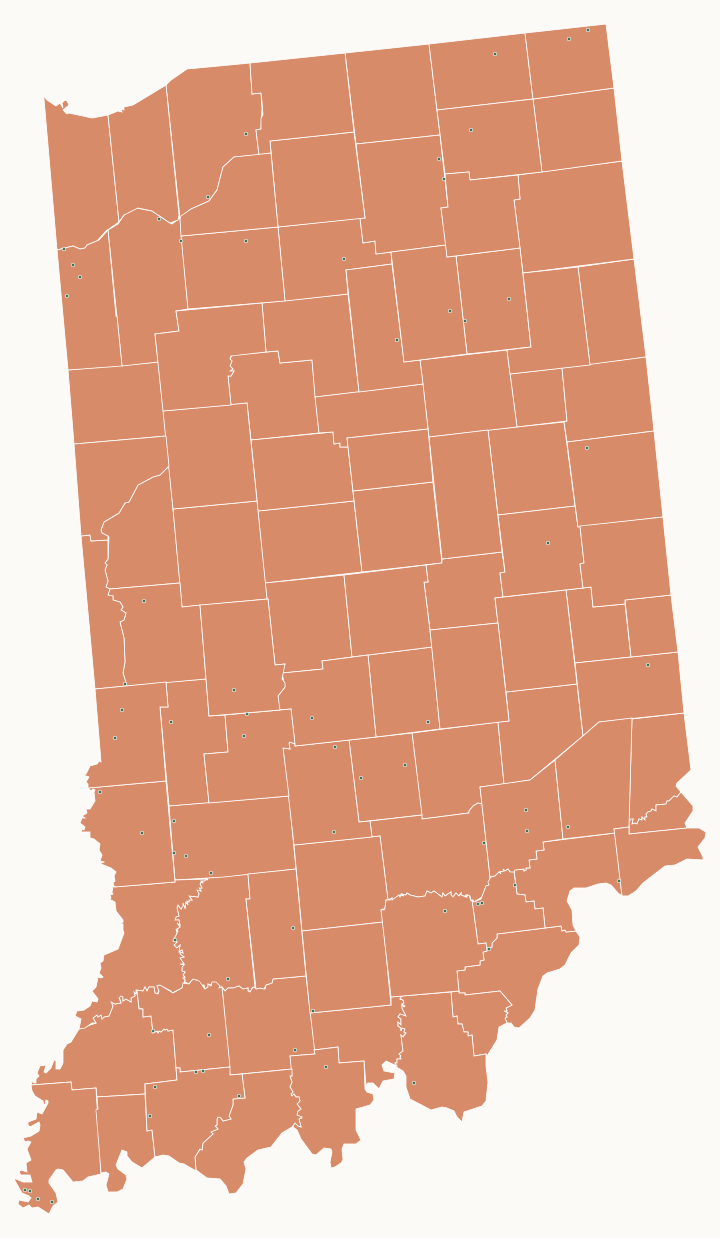
All 92 counties, with the DNR's harvest for the 2025 season and the public land in each.
| County | Deer harvested | Year | Public land | Properties |
|---|---|---|---|---|
| Adams County | 1,107 | 2025 | 0.1% | 0 |
| Allen County | 1,932 | 2025 | 1.7% | 0 |
| Bartholomew County | 850 | 2025 | 0.6% | 1 |
| Benton County | 183 | 2025 | 0.6% | 0 |
| Blackford County | 602 | 2025 | 0% | 0 |
| Boone County | 552 | 2025 | 0.6% | 0 |
| Brown County | 1,400 | 2025 | 33.7% | 4 |
| Carroll County | 1,281 | 2025 | 0.1% | 2 |
| Cass County | 1,607 | 2025 | 0.3% | 0 |
| Clark County | 1,238 | 2025 | 8.9% | 1 |
| Clay County | 1,349 | 2025 | 1.2% | 1 |
| Clinton County | 557 | 2025 | 0% | 0 |
| Crawford County | 2,118 | 2025 | 20.2% | 4 |
| Daviess County | 1,385 | 2025 | 4% | 5 |
| Dearborn County | 1,905 | 2025 | 0.6% | 0 |
| Decatur County | 593 | 2025 | 0.1% | 1 |
| DeKalb County | 3,007 | 2025 | 0.5% | 0 |
| Delaware County | 1,049 | 2025 | 1.4% | 0 |
| Dubois County | 2,018 | 2025 | 4.4% | 4 |
| Elkhart County | 2,178 | 2025 | 1.4% | 0 |
| Fayette County | 831 | 2025 | 0.2% | 0 |
| Floyd County | 726 | 2025 | 2.4% | 0 |
| Fountain County | 1,533 | 2025 | 0.4% | 0 |
| Franklin County | 2,108 | 2025 | 4.1% | 1 |
| Fulton County | 1,665 | 2025 | 0.4% | 3 |
| Gibson County | 1,273 | 2025 | 2.5% | 2 |
| Grant County | 1,220 | 2025 | 0.7% | 0 |
| Greene County | 2,158 | 2025 | 5.6% | 6 |
| Hamilton County | 626 | 2025 | 2% | 0 |
| Hancock County | 422 | 2025 | 0.2% | 0 |
| Harrison County | 3,149 | 2025 | 7% | 1 |
| Hendricks County | 802 | 2025 | 0.7% | 0 |
| Henry County | 785 | 2025 | 2.2% | 2 |
| Howard County | 590 | 2025 | 0.7% | 0 |
| Huntington County | 1,272 | 2025 | 6.8% | 2 |
| Jackson County | 1,232 | 2025 | 11.8% | 5 |
| Jasper County | 1,519 | 2025 | 2% | 2 |
| Jay County | 1,537 | 2025 | 0.1% | 0 |
| Jefferson County | 1,219 | 2025 | 9.1% | 3 |
| Jennings County | 830 | 2025 | 7.7% | 4 |
| Johnson County | 650 | 2025 | 3% | 1 |
| Knox County | 1,046 | 2025 | 0.4% | 3 |
| Kosciusko County | 2,718 | 2025 | 1.4% | 6 |
| LaGrange County | 3,079 | 2025 | 4.2% | 3 |
| Lake County | 1,523 | 2025 | 4.4% | 2 |
| LaPorte County | 2,204 | 2025 | 3.1% | 7 |
| Lawrence County | 2,381 | 2025 | 6.4% | 2 |
| Madison County | 715 | 2025 | 0.4% | 0 |
| Marion County | 418 | 2025 | 6% | 0 |
| Marshall County | 2,665 | 2025 | 0.5% | 1 |
| Martin County | 991 | 2025 | 8.5% | 3 |
| Miami County | 1,750 | 2025 | 0.9% | 1 |
| Monroe County | 1,652 | 2025 | 22.5% | 6 |
| Montgomery County | 1,215 | 2025 | 1% | 0 |
| Morgan County | 1,701 | 2025 | 3.6% | 3 |
| Newton County | 1,166 | 2025 | 9% | 4 |
| Noble County | 2,883 | 2025 | 2.5% | 8 |
| Ohio County | 502 | 2025 | 0% | 0 |
| Orange County | 2,010 | 2025 | 18.7% | 3 |
| Owen County | 2,277 | 2025 | 5.5% | 2 |
| Parke County | 2,557 | 2025 | 3.2% | 4 |
| Perry County | 1,771 | 2025 | 26.6% | 2 |
| Pike County | 1,482 | 2025 | 9.5% | 5 |
| Porter County | 794 | 2025 | 5.7% | 0 |
| Posey County | 1,273 | 2025 | 4.6% | 4 |
| Pulaski County | 2,273 | 2025 | 3.9% | 3 |
| Putnam County | 2,721 | 2025 | 2.7% | 3 |
| Randolph County | 941 | 2025 | 0.3% | 2 |
| Ripley County | 1,276 | 2025 | 11.1% | 1 |
| Rush County | 426 | 2025 | 0% | 0 |
| Scott County | 539 | 2025 | 9.1% | 4 |
| Shelby County | 567 | 2025 | 0.1% | 0 |
| Spencer County | 1,217 | 2025 | 3.1% | 1 |
| St. Joseph County | 1,448 | 2025 | 3% | 0 |
| Starke County | 2,013 | 2025 | 2.2% | 7 |
| Steuben County | 3,571 | 2025 | 3.6% | 4 |
| Sullivan County | 1,952 | 2025 | 9.2% | 3 |
| Switzerland County | 1,236 | 2025 | 1.4% | 1 |
| Tippecanoe County | 1,324 | 2025 | 1.6% | 0 |
| Tipton County | 213 | 2025 | 0.1% | 0 |
| Union County | 676 | 2025 | 8.8% | 1 |
| Vanderburgh County | 736 | 2025 | 1.1% | 0 |
| Vermillion County | 1,000 | 2025 | 0.7% | 2 |
| Vigo County | 1,685 | 2025 | 3.9% | 4 |
| Wabash County | 1,638 | 2025 | 6.3% | 2 |
| Warren County | 1,255 | 2025 | 0.2% | 0 |
| Warrick County | 1,254 | 2025 | 3.5% | 5 |
| Washington County | 2,616 | 2025 | 5.8% | 3 |
| Wayne County | 1,310 | 2025 | 0.2% | 0 |
| Wells County | 916 | 2025 | 1.2% | 1 |
| White County | 1,275 | 2025 | 0.1% | 0 |
| Whitley County | 1,317 | 2025 | 0.3% | 3 |
Harvest: Indiana DNR White-tailed Deer Reports (2021 to 2025 seasons, Table 3-4). Public land: USGS PAD-US 4.1 (fee land open to the public) and the DNR's public hunting property boundaries.
How much of Indiana is public hunting land?
953,674 acres of Indiana, 4.1% of the state, are public land open to the public, by USGS PAD-US 4.1 and the DNR's public hunting property boundaries: properties open to public hunting (DNR map) 637,488 acres, state parks 70,595 acres, county, city and regional land 65,121 acres, other DNR land 60,400 acres, federal land, mostly Corps of Engineers lakes 55,141 acres and land trusts and other open land 48,097 acres.
Indiana's largest public hunting ground is in the south: the Hoosier National Forest, the state forests around it, and fish and wildlife areas such as Glendale, Goose Pond and Atterbury. The DNR's Private Lands Access program opens private land too, but its hunts are drawn, so that land is not mapped here (DNR: Private Lands Access).
Which public hunting properties are the largest?
DNR-listed properties with deer hunting, with a page of their own, largest first:
- Hoosier National Forest: 202,389 acres
- Big Oaks National Wildlife Refuge: 49,905 acres
- Patoka Lake: 25,983 acres
- Clark State Forest: 24,804 acres
- Morgan-Monroe State Forest: 24,729 acres
- Yellowwood State Forest: 24,360 acres
- Harrison-Crawford State Forest: 24,240 acres
- Jackson-Washington State Forest: 18,488 acres
- Pigeon River Fish and Wildlife Area: 11,503 acres
- Willow Slough Fish and Wildlife Area: 9,923 acres
- Martin State Forest: 9,745 acres
- Patoka River National Wildlife Refuge: 9,041 acres
- Goose Pond Fish and Wildlife Area: 9,018 acres
- Sugar Ridge Fish and Wildlife Area: 8,907 acres
- Fairbanks Landing Fish and Wildlife Area: 8,788 acres
- J. Edward Roush Fish and Wildlife Area: 8,335 acres
- Glendale Fish and Wildlife Area: 8,116 acres
- Jasper-Pulaski Fish and Wildlife Area: 7,958 acres
- Ferdinand State Forest: 7,893 acres
- Greene-Sullivan State Forest: 7,821 acres
- Muscatatuck National Wildlife Refuge: 7,710 acres
- Hovey Lake Fish and Wildlife Area: 7,234 acres
- Kankakee Sands: 6,734 acres
- Owen-Putnam State Forest: 6,710 acres
- Kingsbury Fish and Wildlife Area: 6,611 acres
71 properties open to public hunting have a page of their own; each county page lists the rest.
Questions hunters ask
When is Indiana's 2026 firearms deer season?
November 14 to 29, 2026. Muzzleloader season follows, December 5 to 20, and archery runs October 1, 2026 to January 3, 2027 (DNR).
How many deer were harvested in Indiana last season?
Hunters took 131,226 deer in the 2025 season: 62,876 antlered and 68,350 antlerless (DNR deer report).
What is Indiana's deer bag limit?
Statewide, 1 antlered and 6 antlerless deer, with each county's own antlerless limit; deer reduction zones have their own limit of 10 deer (DNR).
Can you shoot antlerless deer with a gun on Indiana public land?
Not during the firearms season on DNR Fish and Wildlife properties or at Mississinewa, Patoka and Salamonie lakes, by the DNR's season rules.
Get a Indiana hunt plan when they open
Hunt plans for Indiana are coming. Join the list and you'll hear first. The first 50 hunters in each new state get their plan free.
Until then, the free FilledTag app for iPhone has a map that works in every state, Indiana included.
Where these numbers come from
- Seasons: Indiana DNR, Deer Hunting Seasons (read October 2026).
- Deer harvest: Indiana DNR White-tailed Deer Reports (2021 to 2025 seasons, Table 3-4).
- Public hunting properties: Indiana DNR properties with public hunting (managed lands layer) and the DNR's hunting information table.
- Public land: USGS PAD-US 4.1 (fee land open to the public) and the DNR's public hunting property boundaries.
FilledTag is not part of the Indiana Department of Natural Resources. The DNR's hunting pages are the final word on every rule.