FilledTag press kit: data stories, facts and contact
FilledTag is a free public-land hunting map for every state, plus hunt plans built from public records, founded in October 2026 by Colorado hunter Jax Coffin with no investors. This page has the facts, three state data stories reporters can use, and a logo and screenshots.
Data updated October 26, 2026. Every figure below names the agency, the report and the year it comes from.
Press is handled in writing. For a written statement, or data for your area, email filledtagdesk@gmail.com.
Who started FilledTag?
Jax Coffin is a Colorado hunter who learned to hunt alone. He didn't grow up with a mentor, family land or friends to tell him where to go, so he taught himself by reading maps and regulations and making mistakes in the field. He built FilledTag for his own hunts and released it to give new hunters the kickstart he never had.
"Someone told you when you can hunt, someone told you where you can't go, but no one showed you the way."
Jax Coffin, founder
FilledTag took no investor money. The map, the data pages and the learning material are free; hunters pay only for a hunt plan for their own hunt. More in his own words on About FilledTag.
FilledTag fact sheet
| What it is | A free public-land hunting map for every state, plus hunt plans built from public records: where a hunter can legally park, camp and sit, and why |
|---|---|
| Founded | October 2026, Colorado |
| Founder | Jax Coffin |
| Funding | No investors |
| Hunting units | 1,456 hunting units across 15 states, from 30 public sources |
| Public ground | 250 million acres of public ground mapped as legal to hunt |
| Roads and trails | 9.3 million roads and trails sorted: open, closed or foot only |
| Mapped data | More than 1.4 TB of mapped data behind every plan |
| Checked | A second, independent check of delivered plans confirmed 4,959 pins and route points on public land and found none on private land |
| Rules | No animal locations, no cameras, no live tracking, and never two hunters sent to the same ground (fair chase) |
| Where | filledtag.com and the free iPhone app |
Where is Colorado's public land? The 10 units with the most ground you can hunt
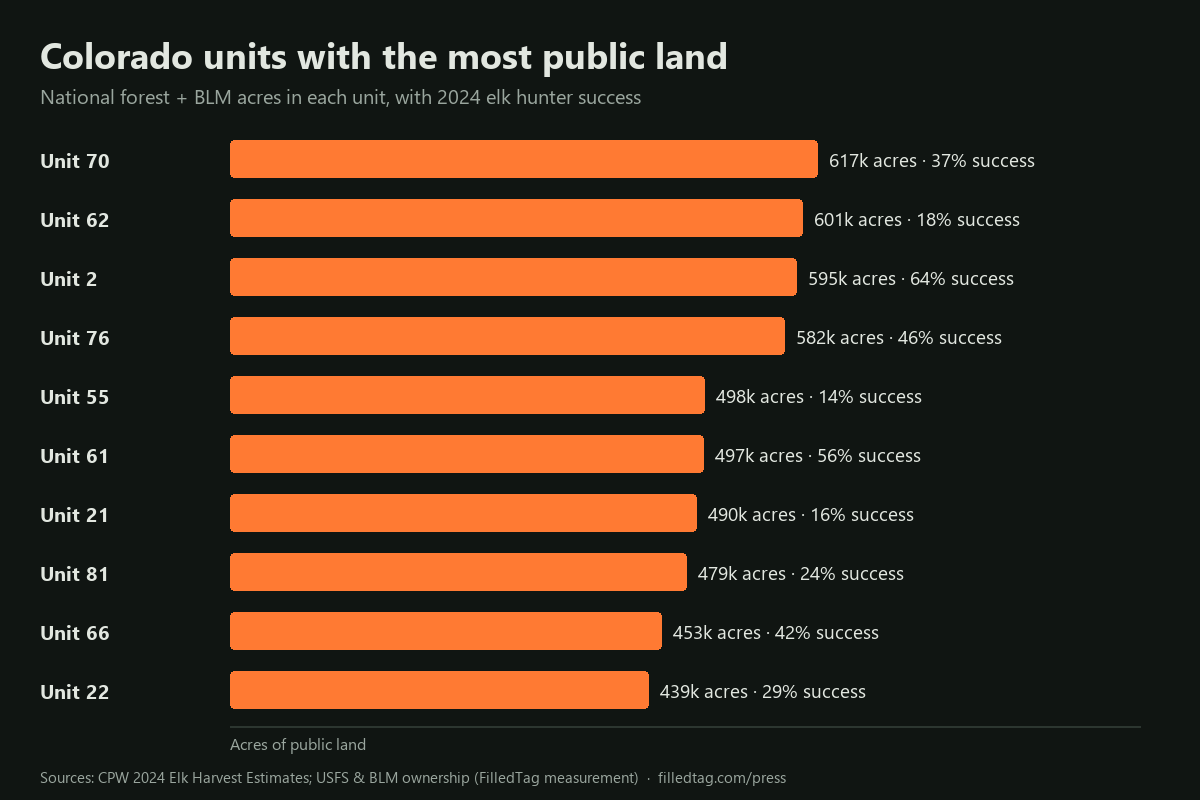
The 10 Colorado hunting units with the most national forest and BLM land hold 5.25 million acres between them, about 23% of the 22.5 million acres of that ground inside all 186 units. Unit 70 (Dolores, Montrose, San Miguel counties) leads with about 617,000 acres, 64% of the unit. Size is not the whole story: in those 10 units, elk hunter success in 2024 ran from 14% to 64%, by Colorado Parks and Wildlife's estimates.
| Rank | Unit | Counties | National forest + BLM acres | Share of unit | Elk hunters, 2024 | Elk harvest, 2024 | Elk success, 2024 |
|---|---|---|---|---|---|---|---|
| 1 | Unit 70 | Dolores, Montrose, San Miguel | 617,000 | 64% | 3,448 | 1,275 | 37% |
| 2 | Unit 62 | Delta, Mesa, Montrose, Ouray | 601,000 | 68% | 5,669 | 1,024 | 18% |
| 3 | Unit 2 | Moffat | 595,000 | 78% | 168 | 107 | 64% |
| 4 | Unit 76 | Hinsdale, Mineral, Rio Grande | 582,000 | 94% | 1,138 | 518 | 46% |
| 5 | Unit 55 | Gunnison | 498,000 | 88% | 2,755 | 397 | 14% |
| 6 | Unit 61 | Mesa, Montrose, Ouray, San Miguel | 497,000 | 84% | 1,296 | 727 | 56% |
| 7 | Unit 21 | Rio Blanco, Garfield | 490,000 | 86% | 1,992 | 324 | 16% |
| 8 | Unit 81 | Alamosa, Archuleta, Conejos, Rio Grande | 479,000 | 62% | 3,726 | 882 | 24% |
| 9 | Unit 66 | Gunnison, Hinsdale, Saguache | 453,000 | 79% | 1,196 | 503 | 42% |
| 10 | Unit 22 | Rio Blanco, Garfield | 439,000 | 69% | 2,668 | 770 | 29% |
Sources: land, BLM National Surface Management Agency (SMA) land status inside Colorado Parks and Wildlife game management unit boundaries, measured by FilledTag, 2026 (national forest and BLM only; state, wildlife area and other public land not counted). Unit size: CPW unit boundaries. Elk hunters, harvest and success: CPW, 2024 Colorado Elk Harvest Estimates, all methods by unit. Unit 2 had only 168 elk hunters in 2024, so its success rate rests on few hunters. All Colorado elk units
Minnesota's busiest deer permit areas: how much public land do they have?
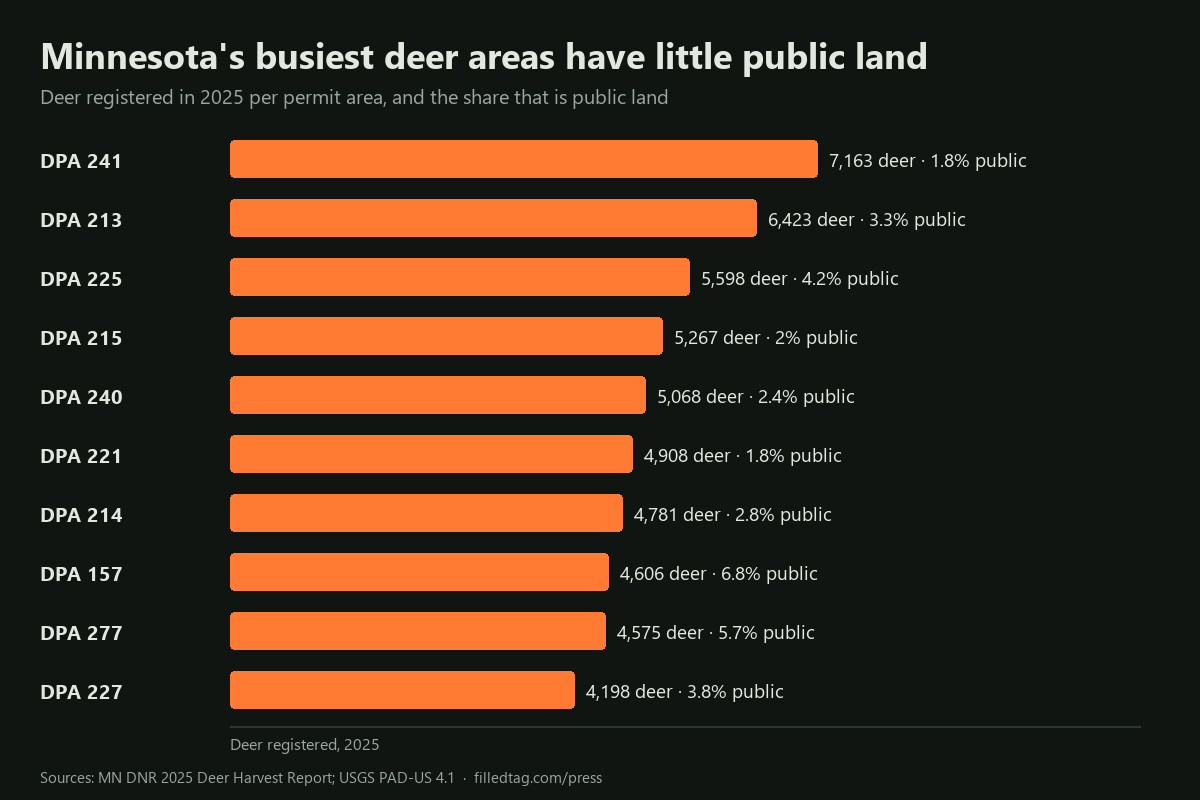
Minnesota's 10 deer permit areas with the most deer registered in 2025 accounted for 52,587 deer, 28% of the state's 186,368, yet public land open to the public makes up only 1.8% to 6.8% of each. DPA 241 (Otter Tail and Wadena counties) led with 7,163 deer. Every one of the 10 registered more deer in 2025 than in 2024, by the Minnesota DNR's harvest reports. For hunters without private land, the wildlife management areas in these permit areas carry much of the load.
| Rank | Permit area | Counties | Deer registered, 2025 | Deer registered, 2024 | Adult bucks, 2025 | Public acres | Public share | WMAs on the DNR map |
|---|---|---|---|---|---|---|---|---|
| 1 | DPA 241 | Otter Tail and Wadena | 7,163 | 6,563 | 3,509 | 11,868 | 1.8% | 14 |
| 2 | DPA 213 | Douglas and Todd | 6,423 | 5,814 | 3,119 | 24,847 | 3.3% | 37 |
| 3 | DPA 225 | Chisago and Isanti | 5,598 | 5,038 | 2,843 | 17,237 | 4.2% | 13 |
| 4 | DPA 215 | Stearns and Morrison | 5,267 | 4,913 | 2,387 | 9,134 | 2% | 11 |
| 5 | DPA 240 | Otter Tail and Todd | 5,068 | 4,457 | 2,347 | 10,687 | 2.4% | 10 |
| 6 | DPA 221 | Morrison and Benton | 4,908 | 4,438 | 2,283 | 7,449 | 1.8% | 12 |
| 7 | DPA 214 | Todd and Morrison | 4,781 | 4,380 | 2,236 | 9,903 | 2.8% | 13 |
| 8 | DPA 157 | Kanabec and Pine | 4,606 | 4,255 | 2,950 | 39,403 | 6.8% | 16 |
| 9 | DPA 277 | Kandiyohi and Meeker | 4,575 | 4,301 | 2,281 | 41,570 | 5.7% | 40 |
| 10 | DPA 227 | Isanti and Anoka | 4,198 | 3,893 | 2,031 | 11,917 | 3.8% | 13 |
Sources: deer, Minnesota DNR Deer Harvest Reports, 2024 and 2025 (registered harvest, all seasons, by permit area). Public land: USGS PAD-US 4.1, fee land open to the public, measured inside each permit area by FilledTag, 2026; PAD-US leaves out most county tax-forfeited land, so public land may be more than shown. WMAs: the DNR's wildlife management area layer. All Minnesota deer permit areas
South Dakota pheasants: the top counties, and how much walk-in ground each has
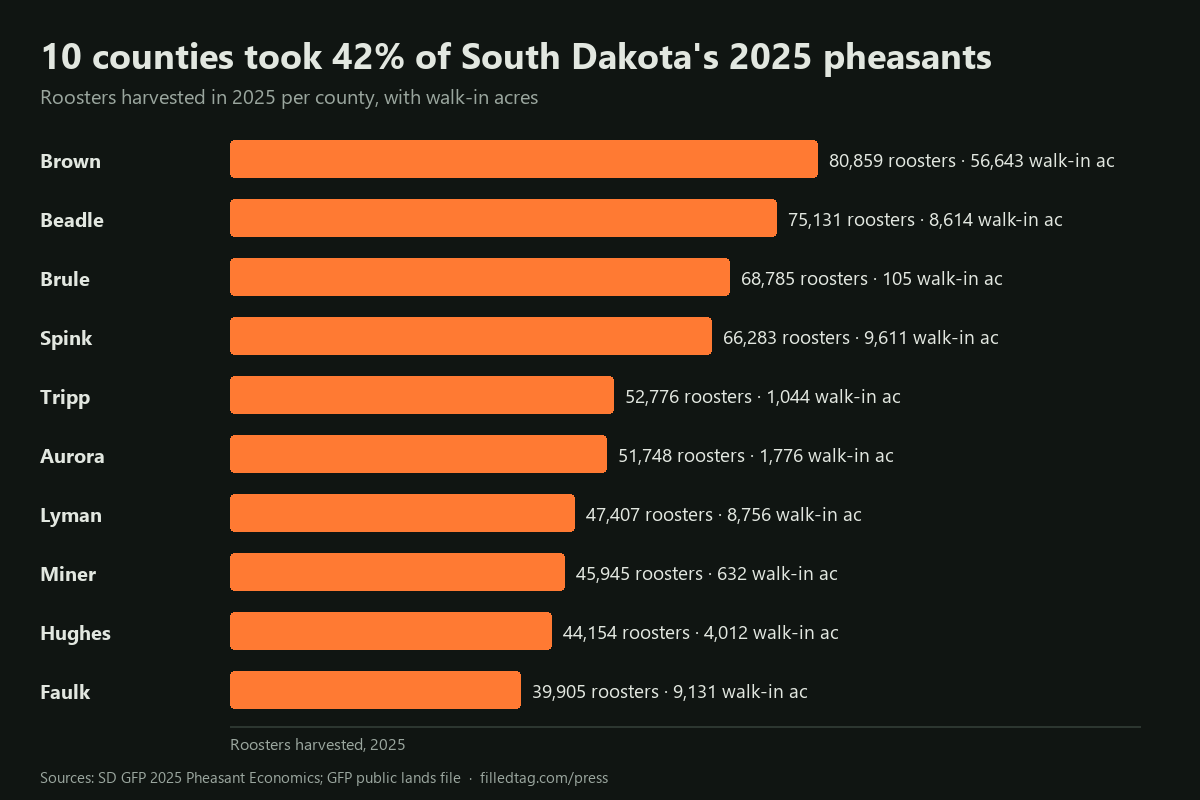
Ten South Dakota counties produced 572,993 of the state's 1,351,081 roosters harvested in 2025, 42%, by the Game, Fish and Parks Department's estimates, but walk-in ground is spread very unevenly among them. Brown County led the harvest with 80,859 birds and also has the most walk-in land of the 10, about 56,643 acres. Brule County, third with 68,785 birds, has about 105 walk-in acres, though its Game Production Areas add about 9,022 acres. Statewide, the 2026 hunting atlas holds about 1.50 million walk-in acres.
| Rank | County | Roosters, 2025 | Resident hunters | Nonresident hunters | Hunter spending | Walk-in acres (WIA + CREP) | Game Production Area acres |
|---|---|---|---|---|---|---|---|
| 1 | Brown | 80,859 | 3,088 | 5,931 | $19.3 million | 56,643 | 12,293 |
| 2 | Beadle | 75,131 | 2,598 | 4,048 | $14.4 million | 8,614 | 3,307 |
| 3 | Brule | 68,785 | 1,838 | 4,609 | $13.6 million | 105 | 9,022 |
| 4 | Spink | 66,283 | 1,519 | 4,048 | $11.7 million | 9,611 | 3,451 |
| 5 | Tripp | 52,776 | 760 | 4,128 | $10.0 million | 1,044 | 1,845 |
| 6 | Aurora | 51,748 | 1,446 | 2,845 | $9.2 million | 1,776 | 2,320 |
| 7 | Lyman | 47,407 | 1,176 | 3,867 | $10.5 million | 8,756 | 12,726 |
| 8 | Miner | 45,945 | 1,764 | 1,723 | $7.8 million | 632 | 4,680 |
| 9 | Hughes | 44,154 | 1,617 | 3,146 | $10.2 million | 4,012 | 5,651 |
| 10 | Faulk | 39,905 | 1,103 | 3,026 | $8.7 million | 9,131 | 2,248 |
Sources: harvest, hunters and spending, South Dakota GFP, 2025 Pheasant Economics table (upland game harvest surveys; a hunter can count in more than one county). Walk-in and Game Production Area acres: GFP's 2025 South Dakota Public Lands file (updated 23 March 2026), less parcels GFP lists as deleted from the 2026 hunting atlas, measured by FilledTag, October 2026. South Dakota pheasant season and public land
Logo and screenshots
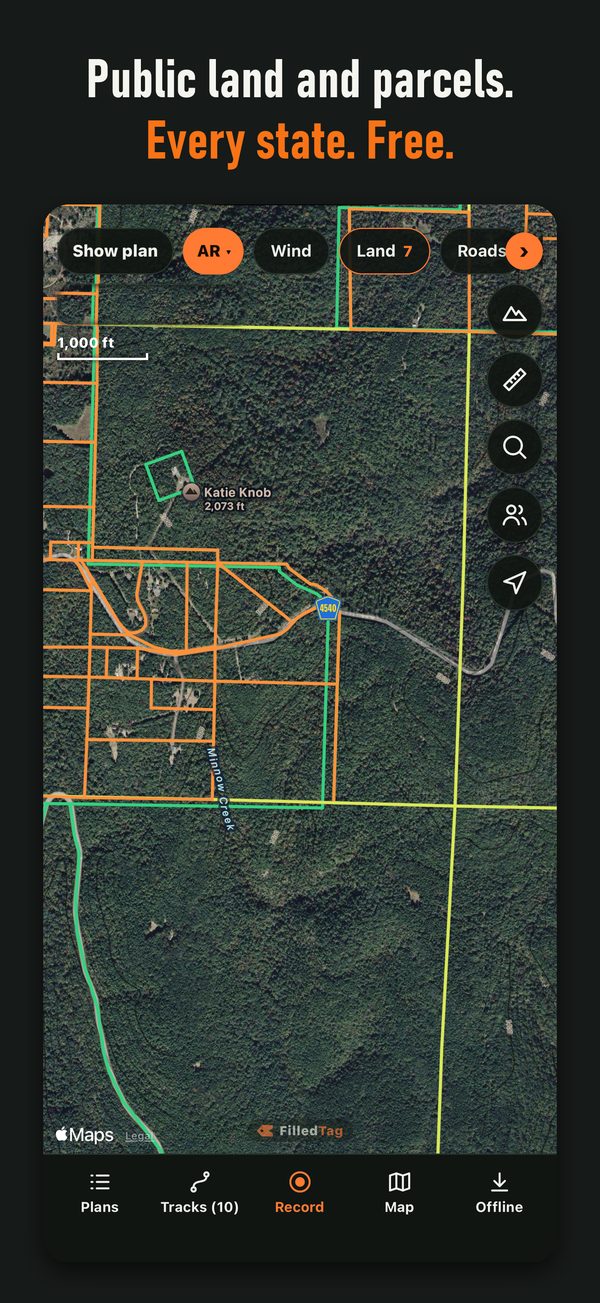
Free to use in coverage of FilledTag. Click an image to open the full file.

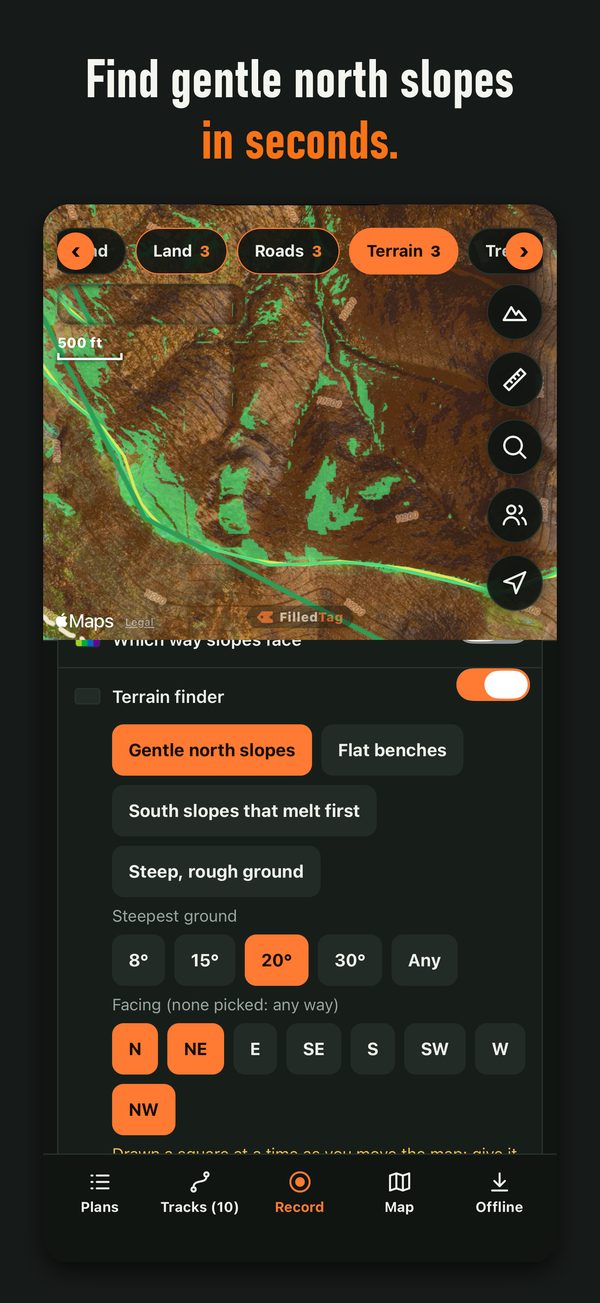
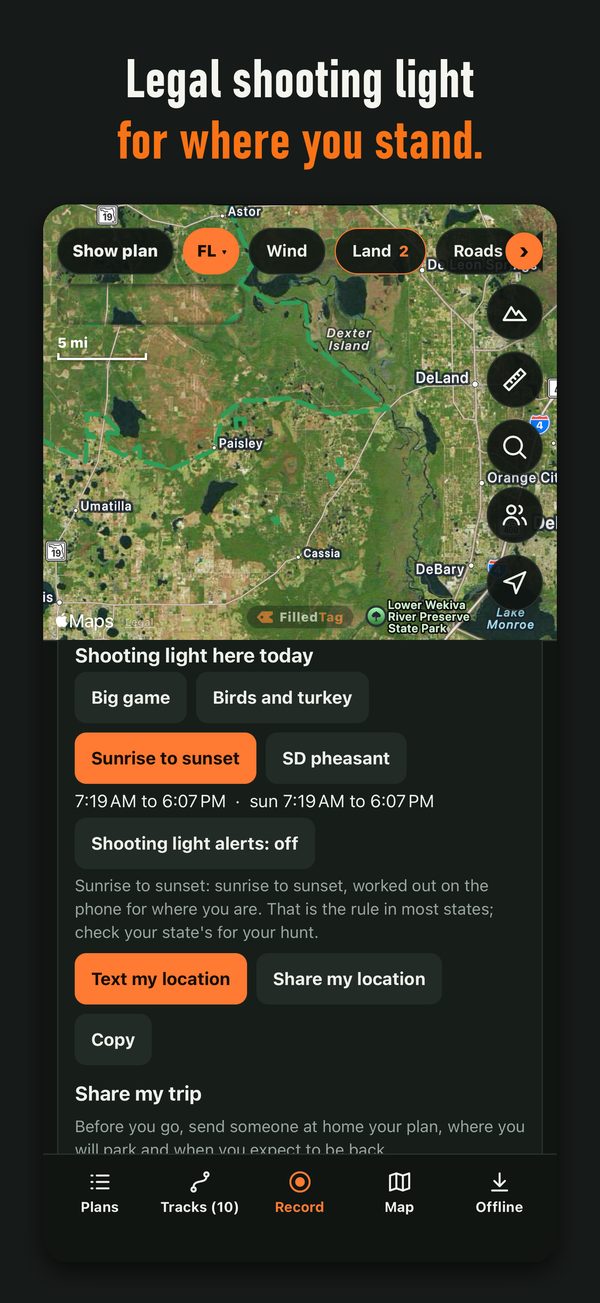
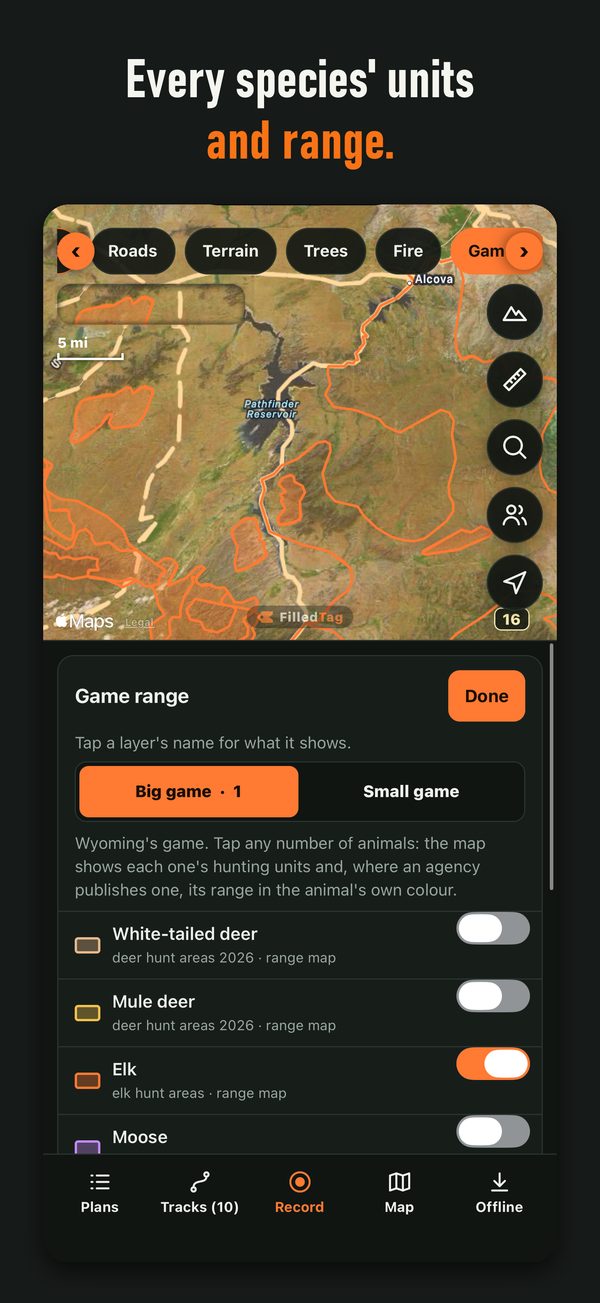
Charts on this page are free to republish with credit to FilledTag and the agencies named under each one.
Need a statement or numbers for your area?
We answer in writing: a quote from the founder, or the same kind of table for your county, unit or permit area, from the agency's own data. Email filledtagdesk@gmail.com.