South Carolina deer harvest by county: every county, 2019 to 2024
SCDNR's 2024 Deer Harvest Report puts South Carolina's harvest at 190,707 deer: 90,670 antlered bucks, 8,230 button bucks, 80,598 does and 11,209 of unknown sex, 8.7 per square mile of deer habitat. By county, Orangeburg County was highest at 10,976, then Anderson (7,773) and Williamsburg (7,440). Per square mile, Anderson County was highest at 22.7.
Data updated October 2026. Harvest: SCDNR Deer Harvest Reports, 2019 to 2024.
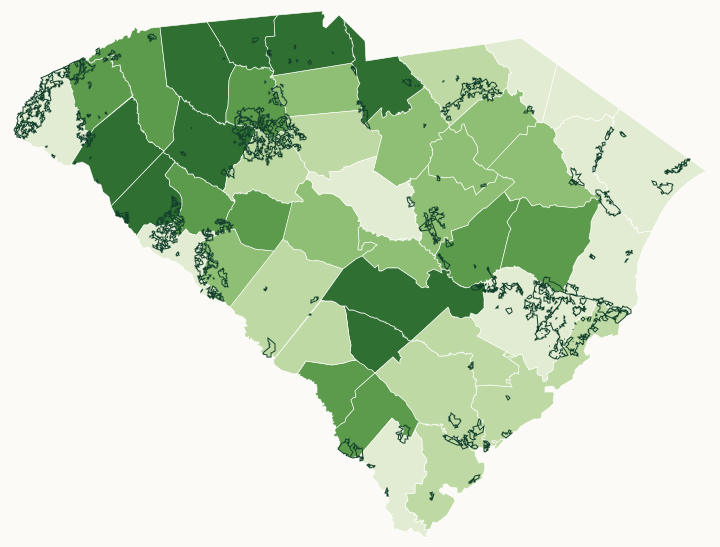
up to 6.3 deer per sq mi of habitat6.3 to 7.8 deer per sq mi of habitat7.8 to 9.1 deer per sq mi of habitat9.1 to 10.2 deer per sq mi of habitatover 10.2 deer per sq mi of habitatWMAs with a page
How many deer are killed in South Carolina each season?
| Season | Deer | Bucks | Does | Per sq mi of habitat | How SCDNR counted |
|---|---|---|---|---|---|
| 2024 | 190,707 | 98,900 | 80,598 | 8.7 | Reported (SC Game Check, corrected) |
| 2023 | 198,171 | 104,353 | 93,818 | 9.3 | Survey estimate |
| 2022 | 179,414 | 98,539 | 80,875 | 8.5 | Survey estimate |
| 2021 | 174,569 | 95,351 | 79,218 | 8.2 | Survey estimate |
| 2020 | 197,893 | 107,212 | 90,681 | 9.3 | Survey estimate |
| 2019 | 193,073 | 105,201 | 87,872 | 9.1 | Survey estimate |
Source: Table 1 of each year's report (SCDNR deer harvest reports). 2024 bucks are antlered and button bucks together; 11,209 deer of unknown sex are in the total only. SCDNR's record harvest was 319,902 in 2002, by its 2024 report.
Which South Carolina counties have the most deer harvested?
| Rank | County | Deer, 2024 | Antlered bucks | Per sq mi of habitat | Deer hunters | Deer, 2019 (survey) |
|---|---|---|---|---|---|---|
| 1 | Orangeburg County | 10,976 | 4,995 | 13.9 | 8,367 | 9,310 |
| 2 | Anderson County | 7,773 | 3,798 | 22.7 | 6,712 | 5,926 |
| 3 | Williamsburg County | 7,440 | 2,967 | 9.3 | 5,070 | 7,666 |
| 4 | Spartanburg County | 7,040 | 3,397 | 16.9 | 6,541 | 7,360 |
| 5 | Colleton County | 6,136 | 2,716 | 7.8 | 6,279 | 7,725 |
| 6 | Laurens County | 5,891 | 2,834 | 11.9 | 6,935 | 6,256 |
| 7 | Aiken County | 5,734 | 2,976 | 7.3 | 6,009 | 4,234 |
| 8 | Berkeley County | 5,557 | 2,597 | 6.3 | 6,016 | 6,133 |
| 9 | Florence County | 5,458 | 2,737 | 8.8 | 3,770 | 5,215 |
| 10 | Hampton County | 5,110 | 2,136 | 10.1 | 4,512 | 5,627 |
| 11 | Kershaw County | 5,103 | 2,635 | 9.1 | 4,978 | 5,797 |
| 12 | Sumter County | 4,808 | 2,323 | 9.1 | 3,698 | 4,476 |
| 13 | York County | 4,727 | 2,292 | 10.9 | 4,676 | 4,669 |
| 14 | Greenville County | 4,711 | 2,402 | 10.2 | 5,208 | 3,943 |
| 15 | Chesterfield County | 4,479 | 2,356 | 7.7 | 3,356 | 3,464 |
| 16 | Lancaster County | 4,407 | 2,198 | 10.6 | 3,829 | 4,713 |
| 17 | Clarendon County | 4,357 | 1,858 | 9.4 | 2,883 | 3,720 |
| 18 | Horry County | 4,237 | 2,298 | 5.1 | 3,678 | 3,064 |
| 19 | Fairfield County | 4,197 | 2,215 | 7 | 6,154 | 5,982 |
| 20 | Chester County | 4,089 | 1,992 | 8.7 | 5,438 | 4,814 |
| 21 | Abbeville County | 4,063 | 1,958 | 11.7 | 4,913 | 3,649 |
| 22 | Bamberg County | 3,977 | 1,629 | 12.9 | 3,474 | 4,856 |
| 23 | Darlington County | 3,969 | 1,894 | 8.9 | 2,686 | 2,716 |
| 24 | Union County | 3,929 | 1,858 | 9.7 | 5,005 | 4,435 |
| 25 | Newberry County | 3,896 | 1,893 | 7.8 | 5,832 | 5,536 |
| 26 | Georgetown County | 3,845 | 1,777 | 6.2 | 3,566 | 2,656 |
| 27 | Dorchester County | 3,530 | 1,581 | 7.5 | 3,527 | 5,088 |
| 28 | Lexington County | 3,520 | 1,788 | 8 | 4,243 | 3,448 |
| 29 | Allendale County | 3,449 | 1,425 | 10.2 | 3,159 | 3,474 |
| 30 | Barnwell County | 3,266 | 1,452 | 7.4 | 2,791 | 4,034 |
| 31 | Edgefield County | 3,258 | 1,469 | 8.5 | 4,006 | 3,434 |
| 32 | Pickens County | 3,147 | 1,585 | 9.2 | 4,033 | 2,679 |
| 33 | Lee County | 3,109 | 1,353 | 9 | 2,141 | 2,641 |
| 34 | Saluda County | 3,032 | 1,405 | 10.1 | 3,304 | 2,627 |
| 35 | Greenwood County | 2,966 | 1,416 | 9.3 | 3,573 | 2,902 |
| 36 | Charleston County | 2,905 | 1,431 | 6.4 | 5,044 | 4,181 |
| 37 | Richland County | 2,884 | 1,462 | 5.4 | 4,230 | 3,151 |
| 38 | Cherokee County | 2,861 | 1,394 | 11.7 | 2,391 | 2,914 |
| 39 | Marlboro County | 2,730 | 1,338 | 6.2 | 1,819 | 2,631 |
| 40 | Calhoun County | 2,518 | 1,216 | 8.5 | 3,041 | 2,571 |
| 41 | Oconee County | 2,314 | 1,283 | 5.2 | 3,566 | 2,182 |
| 42 | Jasper County | 2,156 | 915 | 4.5 | 2,075 | 3,472 |
| 43 | Marion County | 2,002 | 980 | 5.9 | 1,747 | 2,278 |
| 44 | Dillon County | 1,789 | 906 | 5.3 | 1,274 | 1,348 |
| 45 | McCormick County | 1,659 | 762 | 5 | 3,008 | 1,239 |
| 46 | Beaufort County | 1,640 | 752 | 7.1 | 1,773 | 2,838 |
Source: SCDNR 2024 Deer Harvest Report, Table 1 (county harvest); SCDNR 2024 Deer Harvest Report, Table 5 (hunters and days by county). Counties are ordered by SCDNR's 2024 harvest figures, most deer first.
Get a South Carolina hunt plan when they open
South Carolina plans are not open yet. They are coming soon. Join the waiting list; the first 50 hunters get one plan free.
Use the map while you wait for your plan.
Sources: SCDNR 2024 Deer Harvest Report; SCDNR deer harvest reports; U.S. Census Bureau 2024 county boundaries. FilledTag is not part of the South Carolina Department of Natural Resources.