Alabama deer harvest by county: every county, 2019-20 to 2024-25
ADCNR's hunter harvest survey estimates Alabama hunters took 330,413 deer in the 2024-25 season, 9,221 of them on WMAs; its separate estimates by sex are 144,828 bucks and 176,220 does. By county, Baldwin County was highest at about 11,543, then Jackson (10,736) and Dallas (8,432). Per square mile, Bullock County was highest at 13.4.
Data updated October 2026. Harvest: ADCNR's hunter harvest survey, 2019-20 to 2024-25.
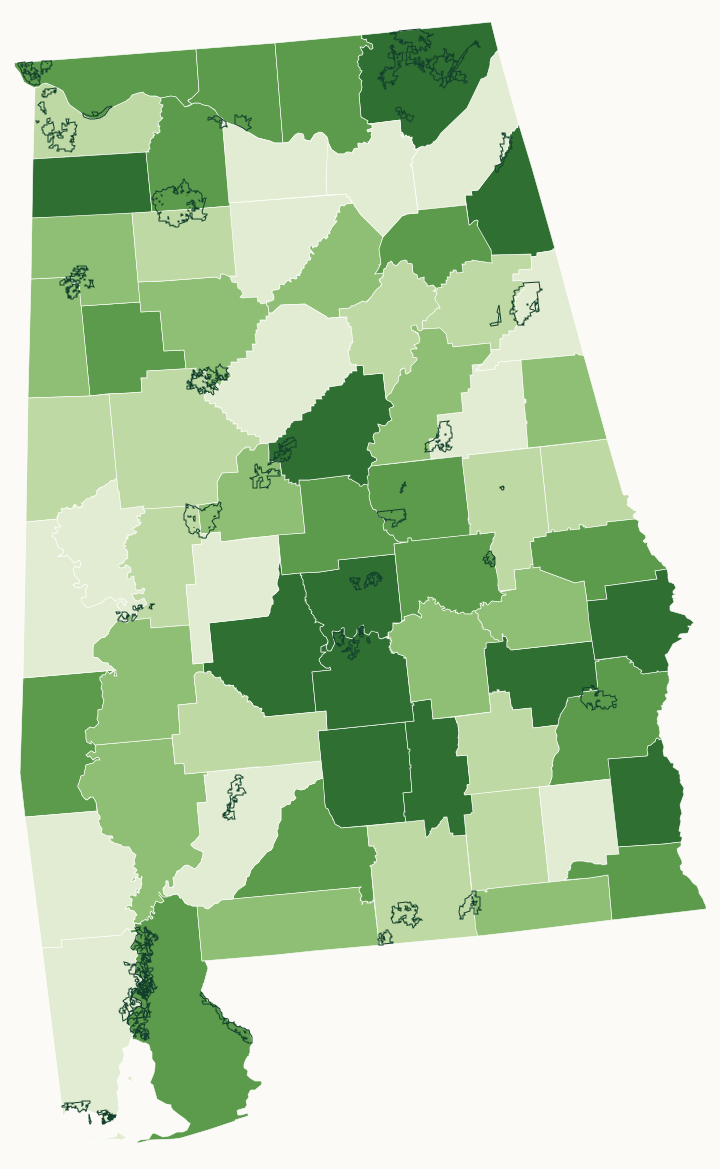
up to 4.6 deer per sq mi4.6 to 5.5 deer per sq mi5.5 to 6.8 deer per sq mi6.8 to 8 deer per sq miover 8 deer per sq miWMAs with a page
How many deer are killed in Alabama each season?
| Season | Deer (estimate) | Bucks | Does | Modern gun | Archery | Primitive weapons | On WMAs | Other public land |
|---|---|---|---|---|---|---|---|---|
| 2024-25 | 330,413 | 144,828 | 176,220 | 255,945 | 63,672 | 11,248 | 9,221 | 9,371 |
| 2023-24 | 314,496 | 147,880 | 158,212 | 240,572 | 61,048 | 13,046 | 8,862 | 11,826 |
| 2022-23 | 308,729 | 141,749 | 160,313 | 231,965 | 66,931 | 10,078 | 9,205 | 7,342 |
| 2021-22 | 301,122 | 134,113 | 160,172 | 228,129 | 63,367 | 10,005 | 7,697 | 7,246 |
| 2020-21 | 272,731 | 123,561 | 141,850 | 209,699 | 55,352 | 8,154 | 6,765 | 12,456 |
| 2019-20 | 218,358 | 94,034 | 118,418 | 169,497 | 42,221 | 6,640 | 6,161 | 6,433 |
| 2018-19 | 203,040 | 83,162 | 114,553 | 157,433 | 39,086 | 6,522 | 6,650 | 4,248 |
Source: the harvest trends table in ADCNR Alabama Hunter Harvest 2024-2025 annual report. Bucks and does are ADCNR's own separate estimates, each with its own bounds, so they do not add up to the deer total. ADCNR marks the 2020-21 season and later with a note: the resident bait privilege license was added that year, so compare with care.
Which Alabama counties have the most deer harvested?
| Rank | County | Deer, 2024-25 | Bucks | Per square mile | Turkeys | Deer, 2019-20 |
|---|---|---|---|---|---|---|
| 1 | Baldwin County | 11,543 | 4,495 | 7.3 | 1,787 | 5,948 |
| 2 | Jackson County | 10,736 | 5,693 | 10 | 1,157 | 3,687 |
| 3 | Dallas County | 8,432 | 2,837 | 8.6 | 860 | 5,027 |
| 4 | Bullock County | 8,371 | 2,486 | 13.4 | 470 | 5,497 |
| 5 | Clarke County | 8,213 | 2,832 | 6.6 | 984 | 5,050 |
| 6 | Henry County | 7,444 | 3,565 | 13.2 | 974 | 3,628 |
| 7 | Butler County | 7,346 | 3,141 | 9.5 | 1,136 | 4,913 |
| 8 | Choctaw County | 7,296 | 2,677 | 8 | 1,237 | 3,968 |
| 9 | Barbour County | 7,097 | 3,626 | 8 | 621 | 5,542 |
| 10 | Franklin County | 7,004 | 3,537 | 11 | 842 | 3,656 |
| 11 | Tuscaloosa County | 6,867 | 3,311 | 5.2 | 771 | 6,891 |
| 12 | Autauga County | 6,852 | 1,766 | 11.5 | 612 | 5,226 |
| 13 | Conecuh County | 6,812 | 3,233 | 8 | 612 | 4,552 |
| 14 | Shelby County | 6,721 | 3,055 | 8.6 | 160 | 3,820 |
| 15 | Russell County | 6,304 | 3,232 | 9.8 | 514 | 4,762 |
| 16 | Lowndes County | 6,048 | 2,703 | 8.4 | 1,022 | 2,343 |
| 17 | Madison County | 5,848 | 2,877 | 7.3 | 541 | 3,252 |
| 18 | Crenshaw County | 5,844 | 2,386 | 9.6 | 377 | 2,463 |
| 19 | Cherokee County | 5,707 | 2,679 | 10.3 | 550 | 2,114 |
| 20 | Escambia County | 5,631 | 1,968 | 6 | 443 | 1,711 |
| 21 | Marengo County | 5,595 | 2,268 | 5.7 | 1,134 | 3,711 |
| 22 | Covington County | 5,509 | 2,452 | 5.3 | 904 | 3,234 |
| 23 | Chilton County | 5,480 | 2,829 | 7.9 | 1,109 | 3,219 |
| 24 | Walker County | 5,239 | 2,207 | 6.6 | 71 | 3,843 |
| 25 | Marion County | 5,067 | 2,457 | 6.8 | 514 | 4,255 |
| 26 | Lawrence County | 5,027 | 2,916 | 7.3 | 310 | 1,515 |
| 27 | Montgomery County | 4,988 | 2,083 | 6.4 | 372 | 5,232 |
| 28 | Elmore County | 4,933 | 3,107 | 8 | 230 | 2,761 |
| 29 | Lauderdale County | 4,786 | 2,305 | 7.2 | 1,193 | 2,712 |
| 30 | Pickens County | 4,729 | 1,618 | 5.4 | 212 | 4,690 |
| 31 | Houston County | 4,532 | 1,463 | 7.8 | 160 | 2,596 |
| 32 | Coosa County | 4,470 | 2,275 | 6.9 | 639 | 3,800 |
| 33 | Lee County | 4,418 | 1,764 | 7.3 | 639 | 2,196 |
| 34 | Talladega County | 4,376 | 2,147 | 5.9 | 447 | 2,619 |
| 35 | Fayette County | 4,352 | 1,511 | 6.9 | 301 | 1,825 |
| 36 | Wilcox County | 4,338 | 1,148 | 4.9 | 735 | 4,793 |
| 37 | Limestone County | 4,297 | 2,688 | 7.6 | 0 | 3,050 |
| 38 | Lamar County | 4,092 | 1,299 | 6.8 | 160 | 3,993 |
| 39 | Tallapoosa County | 3,921 | 2,015 | 5.5 | 160 | 2,539 |
| 40 | Monroe County | 3,914 | 1,228 | 3.8 | 390 | 3,353 |
| 41 | Randolph County | 3,799 | 1,268 | 6.5 | 527 | 1,976 |
| 42 | Blount County | 3,792 | 1,713 | 5.9 | 685 | 1,655 |
| 43 | Sumter County | 3,782 | 2,029 | 4.2 | 1,442 | 3,817 |
| 44 | Etowah County | 3,671 | 1,241 | 6.9 | 762 | 1,177 |
| 45 | Pike County | 3,671 | 1,986 | 5.5 | 1,561 | 2,118 |
| 46 | Bibb County | 3,653 | 1,312 | 5.9 | 151 | 2,166 |
| 47 | DeKalb County | 3,608 | 1,764 | 4.6 | 311 | 2,283 |
| 48 | Macon County | 3,569 | 1,299 | 5.9 | 700 | 3,751 |
| 49 | Washington County | 3,469 | 1,586 | 3.2 | 2,163 | 3,102 |
| 50 | Jefferson County | 3,393 | 1,191 | 3.1 | 543 | 1,418 |
| 51 | Calhoun County | 3,309 | 1,472 | 5.5 | 470 | 1,346 |
| 52 | Geneva County | 3,266 | 1,559 | 5.7 | 80 | 1,788 |
| 53 | Coffee County | 3,223 | 1,290 | 4.7 | 301 | 2,271 |
| 54 | Hale County | 3,175 | 1,837 | 4.9 | 240 | 3,190 |
| 55 | Mobile County | 3,163 | 1,444 | 2.6 | 399 | 2,064 |
| 56 | St. Clair County | 3,016 | 853 | 4.8 | 951 | 2,018 |
| 57 | Winston County | 2,941 | 1,771 | 4.8 | 1,085 | 3,509 |
| 58 | Chambers County | 2,910 | 1,360 | 4.9 | 550 | 2,751 |
| 59 | Perry County | 2,887 | 1,778 | 4 | 632 | 3,178 |
| 60 | Colbert County | 2,840 | 1,418 | 4.8 | 612 | 1,706 |
| 61 | Clay County | 2,682 | 1,153 | 4.4 | 429 | 2,074 |
| 62 | Marshall County | 2,519 | 869 | 4.5 | 310 | 768 |
| 63 | Cleburne County | 2,064 | 767 | 3.7 | 452 | 1,131 |
| 64 | Greene County | 1,825 | 700 | 2.8 | 230 | 4,274 |
| 65 | Dale County | 1,680 | 899 | 3 | 399 | 2,164 |
| 66 | Cullman County | 1,507 | 993 | 2.1 | 0 | 2,237 |
| 67 | Morgan County | 933 | 773 | 1.6 | 80 | 1,441 |
Source: ADCNR Alabama Hunter Harvest 2024-2025 annual report and earlier reports. County estimates add up to 320,526 for 2024-25; the rest of the statewide figure is deer the survey could not place in a county.
Request your free Alabama hunt plan
The first 50 hunters in Alabama get one hunt plan free. Request yours now. We will email you when your plan is ready.
Use the map while you wait for your plan.
Sources: ADCNR Alabama Hunter Harvest 2024-2025 annual report; ADCNR hunter survey results; U.S. Census Bureau 2024 county boundaries. FilledTag is not part of the Alabama Department of Conservation and Natural Resources.