Missouri deer hunting: harvest by county, conservation areas and public land
Missouri hunters checked 301,125 deer in the 2025 season, 144,772 of them antlered bucks, by MDC's harvest summary. For 2026 MDC removed the CWD portion of the firearms season and the antler-point restriction in every county, and nonresidents may take one antlered deer across archery and firearms combined (MDC).
Data updated October 2026. Seasons: MDC's deer page, read October 2026. Harvest: MDC's deer harvest summaries. Land: PAD-US 4.1, MDC's conservation area layer and MRAP layer.
Missouri hunt plans are coming
Hunt plans for Missouri are coming. Join the list and you'll hear first. The first 50 hunters in each new state get their plan free. Join the Missouri list.
When are Missouri's 2026 hunting seasons?
Missouri's 2026 deer seasons, from MDC's deer hunting page. Permits, limits and the counties open in each antlerless portion are there too.
| Season | Dates |
|---|---|
| Archery | September 15 to November 13, 2026, and November 25, 2026 to January 15, 2027 |
| Firearms: early antlerless portion | October 9 to 11, 2026 |
| Firearms: early youth portion | October 24 to 25, 2026 |
| Firearms: November portion | November 14 to 24, 2026 |
| Firearms: late youth portion | November 27 to 29, 2026 |
| Firearms: late antlerless portion | December 5 to 13, 2026 |
| Firearms: alternative methods portion | December 26, 2026 to January 5, 2027 |
Source: MDC, Deer (read October 2026). New for 2026, in MDC's words: the CWD Management Zone and the CWD portion are removed, the antler-point restriction is removed for all counties, and new managed deer hunts were added while others were removed or changed.
How many deer do Missouri hunters take?
Deer checked by hunters, statewide, by season. Antlerless deer are button bucks and does together.
| Season | Deer checked | Antlered bucks | Button bucks | Does |
|---|---|---|---|---|
| 2025 | 301,125 | 144,772 | 25,063 | 131,290 |
| 2024 | 275,656 | 128,935 | 23,779 | 122,942 |
| 2023 | 326,448 | 147,850 | 29,094 | 149,504 |
| 2022 | 299,719 | 140,735 | 27,028 | 131,956 |
| 2021 | 295,143 | 143,815 | 26,750 | 124,578 |
Source: MDC deer harvest summaries (2021 to 2025 seasons), the season summary table of each year.
How many deer are checked in each Missouri county?
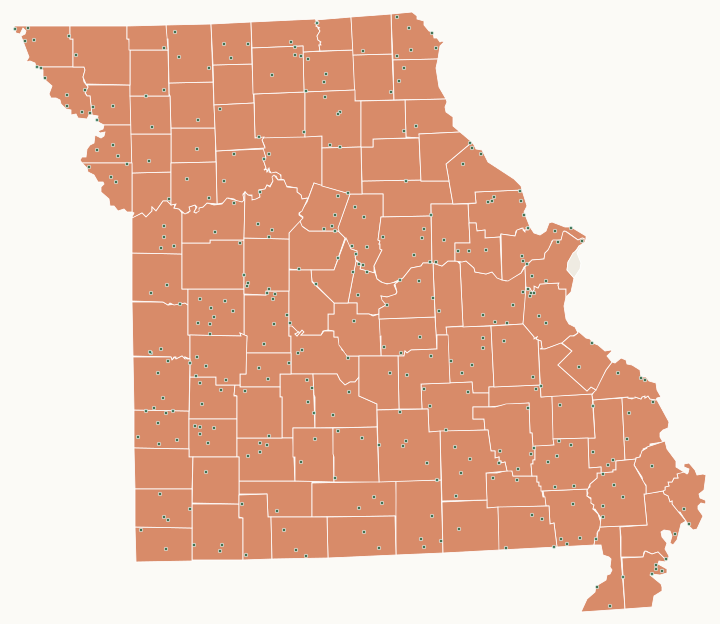
All 115 counties, with MDC's harvest for the 2025 season and the public land in each.
| County | Deer harvested | Year | Public land | Conservation areas |
|---|---|---|---|---|
| Adair County | 2,639 | 2025 | 2.9% | 9 |
| Andrew County | 1,065 | 2025 | 2.4% | 14 |
| Atchison County | 540 | 2025 | 3% | 10 |
| Audrain County | 2,305 | 2025 | 0.6% | 8 |
| Barry County | 2,538 | 2025 | 14.7% | 4 |
| Barton County | 1,844 | 2025 | 2.9% | 16 |
| Bates County | 2,316 | 2025 | 1.2% | 7 |
| Benton County | 4,228 | 2025 | 12.9% | 12 |
| Bollinger County | 3,992 | 2025 | 4.3% | 10 |
| Boone County | 3,439 | 2025 | 4.4% | 19 |
| Buchanan County | 867 | 2025 | 2.1% | 16 |
| Butler County | 1,852 | 2025 | 13.7% | 13 |
| Caldwell County | 2,129 | 2025 | 0.7% | 2 |
| Callaway County | 5,197 | 2025 | 4.4% | 11 |
| Camden County | 3,714 | 2025 | 4.4% | 9 |
| Cape Girardeau County | 3,186 | 2025 | 2.3% | 10 |
| Carroll County | 2,358 | 2025 | 0.9% | 5 |
| Carter County | 2,210 | 2025 | 41.7% | 4 |
| Cass County | 2,731 | 2025 | 1.6% | 12 |
| Cedar County | 2,334 | 2025 | 8.9% | 6 |
| Chariton County | 2,331 | 2025 | 2.6% | 10 |
| Christian County | 2,458 | 2025 | 15.5% | 3 |
| Clark County | 2,750 | 2025 | 2.8% | 7 |
| Clay County | 1,139 | 2025 | 7.2% | 4 |
| Clinton County | 1,016 | 2025 | 3.4% | 3 |
| Cole County | 2,029 | 2025 | 2.6% | 15 |
| Cooper County | 2,320 | 2025 | 2% | 5 |
| Crawford County | 3,667 | 2025 | 13.5% | 11 |
| Dade County | 1,702 | 2025 | 9.4% | 10 |
| Dallas County | 2,951 | 2025 | 3.1% | 8 |
| Daviess County | 2,873 | 2025 | 0.3% | 6 |
| DeKalb County | 1,097 | 2025 | 1.8% | 7 |
| Dent County | 2,659 | 2025 | 19.9% | 7 |
| Douglas County | 3,695 | 2025 | 8.3% | 6 |
| Dunklin County | 496 | 2025 | 2% | 8 |
| Franklin County | 6,751 | 2025 | 3.1% | 20 |
| Gasconade County | 4,073 | 2025 | 0.5% | 6 |
| Gentry County | 1,536 | 2025 | 0.7% | 5 |
| Greene County | 2,955 | 2025 | 2.3% | 9 |
| Grundy County | 1,812 | 2025 | 0.8% | 2 |
| Harrison County | 3,220 | 2025 | 2% | 7 |
| Henry County | 3,300 | 2025 | 14.2% | 16 |
| Hickory County | 2,578 | 2025 | 9.2% | 5 |
| Holt County | 849 | 2025 | 8.3% | 11 |
| Howard County | 2,304 | 2025 | 3.5% | 10 |
| Howell County | 5,474 | 2025 | 10% | 8 |
| Iron County | 1,903 | 2025 | 31.7% | 6 |
| Jackson County | 2,415 | 2025 | 7.9% | 13 |
| Jasper County | 2,607 | 2025 | 0.3% | 3 |
| Jefferson County | 5,173 | 2025 | 1.9% | 9 |
| Johnson County | 3,057 | 2025 | 1.7% | 5 |
| Knox County | 2,646 | 2025 | 0.4% | 2 |
| Laclede County | 3,328 | 2025 | 7.3% | 13 |
| Lafayette County | 1,684 | 2025 | 1.2% | 10 |
| Lawrence County | 2,088 | 2025 | 1.4% | 5 |
| Lewis County | 2,407 | 2025 | 3.1% | 6 |
| Lincoln County | 4,503 | 2025 | 4.3% | 11 |
| Linn County | 2,590 | 2025 | 3.1% | 4 |
| Livingston County | 2,120 | 2025 | 2.8% | 4 |
| Macon County | 4,525 | 2025 | 3.4% | 13 |
| Madison County | 2,892 | 2025 | 17.8% | 6 |
| Maries County | 2,204 | 2025 | 0.8% | 6 |
| Marion County | 2,339 | 2025 | 1.6% | 10 |
| McDonald County | 1,907 | 2025 | 1.5% | 6 |
| Mercer County | 2,036 | 2025 | 1% | 5 |
| Miller County | 2,850 | 2025 | 3.6% | 8 |
| Mississippi County | 282 | 2025 | 2.6% | 5 |
| Moniteau County | 1,822 | 2025 | 1.8% | 7 |
| Monroe County | 3,749 | 2025 | 0.7% | 6 |
| Montgomery County | 3,419 | 2025 | 1.4% | 5 |
| Morgan County | 3,962 | 2025 | 1% | 8 |
| New Madrid County | 323 | 2025 | 1.5% | 5 |
| Newton County | 2,890 | 2025 | 1.4% | 11 |
| Nodaway County | 1,433 | 2025 | 1.2% | 5 |
| Oregon County | 4,176 | 2025 | 21.2% | 4 |
| Osage County | 3,740 | 2025 | 1.2% | 8 |
| Ozark County | 2,819 | 2025 | 14.1% | 7 |
| Pemiscot County | 169 | 2025 | 2.9% | 7 |
| Perry County | 3,160 | 2025 | 1.1% | 5 |
| Pettis County | 2,867 | 2025 | 0.9% | 14 |
| Phelps County | 2,723 | 2025 | 16% | 7 |
| Pike County | 4,848 | 2025 | 3.9% | 10 |
| Platte County | 1,153 | 2025 | 2.9% | 10 |
| Polk County | 3,152 | 2025 | 3.1% | 7 |
| Pulaski County | 2,501 | 2025 | 11.4% | 5 |
| Putnam County | 2,336 | 2025 | 1.7% | 5 |
| Ralls County | 2,742 | 2025 | 0.4% | 5 |
| Randolph County | 2,476 | 2025 | 2.3% | 6 |
| Ray County | 1,800 | 2025 | 0.7% | 11 |
| Reynolds County | 2,746 | 2025 | 30.7% | 8 |
| Ripley County | 3,088 | 2025 | 27.2% | 5 |
| Saline County | 2,048 | 2025 | 2.7% | 9 |
| Schuyler County | 1,512 | 2025 | 0.6% | 3 |
| Scotland County | 2,640 | 2025 | 1.5% | 3 |
| Scott County | 900 | 2025 | 0.7% | 6 |
| Shannon County | 3,030 | 2025 | 41.7% | 8 |
| Shelby County | 2,559 | 2025 | 0.8% | 6 |
| St. Charles County | 2,141 | 2025 | 8.3% | 11 |
| St. Clair County | 3,383 | 2025 | 11.8% | 15 |
| St. Francois County | 3,381 | 2025 | 4.4% | 6 |
| St. Louis County | 1,922 | 2025 | 9.8% | 25 |
| Ste. Genevieve County | 3,306 | 2025 | 5.7% | 5 |
| Stoddard County | 1,935 | 2025 | 4.3% | 7 |
| Stone County | 2,137 | 2025 | 16.5% | 10 |
| Sullivan County | 2,577 | 2025 | 2.5% | 7 |
| Taney County | 2,452 | 2025 | 24.7% | 6 |
| Texas County | 4,974 | 2025 | 9.1% | 13 |
| Vernon County | 3,131 | 2025 | 5% | 15 |
| Warren County | 2,787 | 2025 | 2.9% | 3 |
| Washington County | 3,425 | 2025 | 20% | 7 |
| Wayne County | 4,081 | 2025 | 26.6% | 13 |
| Webster County | 2,914 | 2025 | 0.5% | 3 |
| Worth County | 1,096 | 2025 | 2% | 3 |
| Wright County | 3,625 | 2025 | 2.2% | 7 |
Harvest: MDC deer harvest summaries (2021 to 2025 seasons). Public land: USGS PAD-US 4.1 (fee land open to the public) and MDC conservation area boundaries.
How much of Missouri is public hunting land?
3,143,094 acres of Missouri, 7% of the state, are public land open to the public, by USGS PAD-US 4.1 and MDC conservation area boundaries: national forest 1,510,128 acres, MDC conservation areas 1,062,914 acres, federal land, mostly Corps of Engineers lakes 251,961 acres, state parks and historic sites 118,307 acres, county, city and regional land 62,471 acres and national wildlife refuges 62,298 acres.
Missouri's big public hunting ground is in the Ozarks: the Mark Twain National Forest and MDC's large forested conservation areas in the south. North of the Missouri River public land is mostly conservation areas and Corps of Engineers land around the big reservoirs.
Which conservation areas are the largest?
MDC conservation areas that list hunting, with a page of their own, largest first:
- Rocky Creek Conservation Area: 42,323 acres
- Sunklands Conservation Area: 40,675 acres
- Angeline Conservation Area: 40,078 acres
- Bull Shoals Lake Management Lands: 35,896 acres
- Current River Conservation Area: 29,828 acres
- Peck Ranch Conservation Area: 29,462 acres
- Stockton Lake Management Lands: 17,023 acres
- Clearwater Lake Management Lands: 16,791 acres
- August A. Busch Jr. Memorial Wetlands at Four Rivers Conservation Area: 13,960 acres
- Indian Trail Conservation Area: 13,562 acres
- Logan Creek Conservation Area: 13,156 acres
- Upper Mississippi Conservation Area: 12,715 acres
- Coldwater Conservation Area: 11,723 acres
- Clearwater Conservation Area: 11,405 acres
- Gist Ranch Conservation Area: 11,206 acres
- Castor River Conservation Area: 10,417 acres
- Thomas Hill Reservoir Conservation Area: 9,320 acres
- Pea Ridge Conservation Area: 8,757 acres
- Schell-Osage Conservation Area: 8,654 acres
- Weldon Spring Conservation Area: 8,539 acres
- Fountain Grove Conservation Area: 8,511 acres
- Truman Reservoir Management Lands (Grand River Bottoms): 8,505 acres
- Union Ridge Conservation Area: 8,353 acres
- Truman Reservoir Management Lands (Upper Tebo Creek): 8,182 acres
- Caney Mountain Conservation Area: 7,977 acres
333 MDC lands have a page of their own; each county page lists the rest.
What is MRAP land?
MDC's Missouri Recreational Access Program (MRAP) pays landowners to open private land to the public. Its layer shows 33 tracts open to some hunting, about 8,181 acres. MRAP land by county.
Questions hunters ask
What changed in Missouri's 2026 deer season?
MDC removed the CWD portion of the firearms season and the CWD Management Zone, though CWD rules still apply in some counties. The antler-point restriction is gone in every county, and nonresidents may take only one antlered deer across archery and firearms combined (MDC).
How many deer were harvested in Missouri last season?
Hunters checked 301,125 deer in the 2025 season: 144,772 antlered bucks, 25,063 button bucks and 131,290 does (MDC harvest summary).
When is Missouri's November firearms portion in 2026?
November 14 to 24, 2026 (MDC).
Can you hunt deer on Missouri conservation areas?
On many. Each area's MDC page lists the hunting it allows, species by species, and some areas allow deer only on managed hunts; the area pages here quote MDC's list.
Get a Missouri hunt plan when they open
Hunt plans for Missouri are coming. Join the list and you'll hear first. The first 50 hunters in each new state get their plan free.
Until then, the free FilledTag app for iPhone has a map that works in every state, Missouri included.
Where these numbers come from
- Seasons: MDC, Deer (read October 2026).
- Deer harvest: MDC deer harvest summaries (2021 to 2025 seasons).
- Conservation areas: MDC conservation area boundaries and each area's page on mdc.mo.gov. MRAP: MDC Missouri Recreational Access Program (MRAP) lands.
- Public land: USGS PAD-US 4.1 (fee land open to the public) and MDC conservation area boundaries.
FilledTag is not part of the Missouri Department of Conservation. MDC's hunting pages are the final word on every rule.